0. Workspace Dashboard
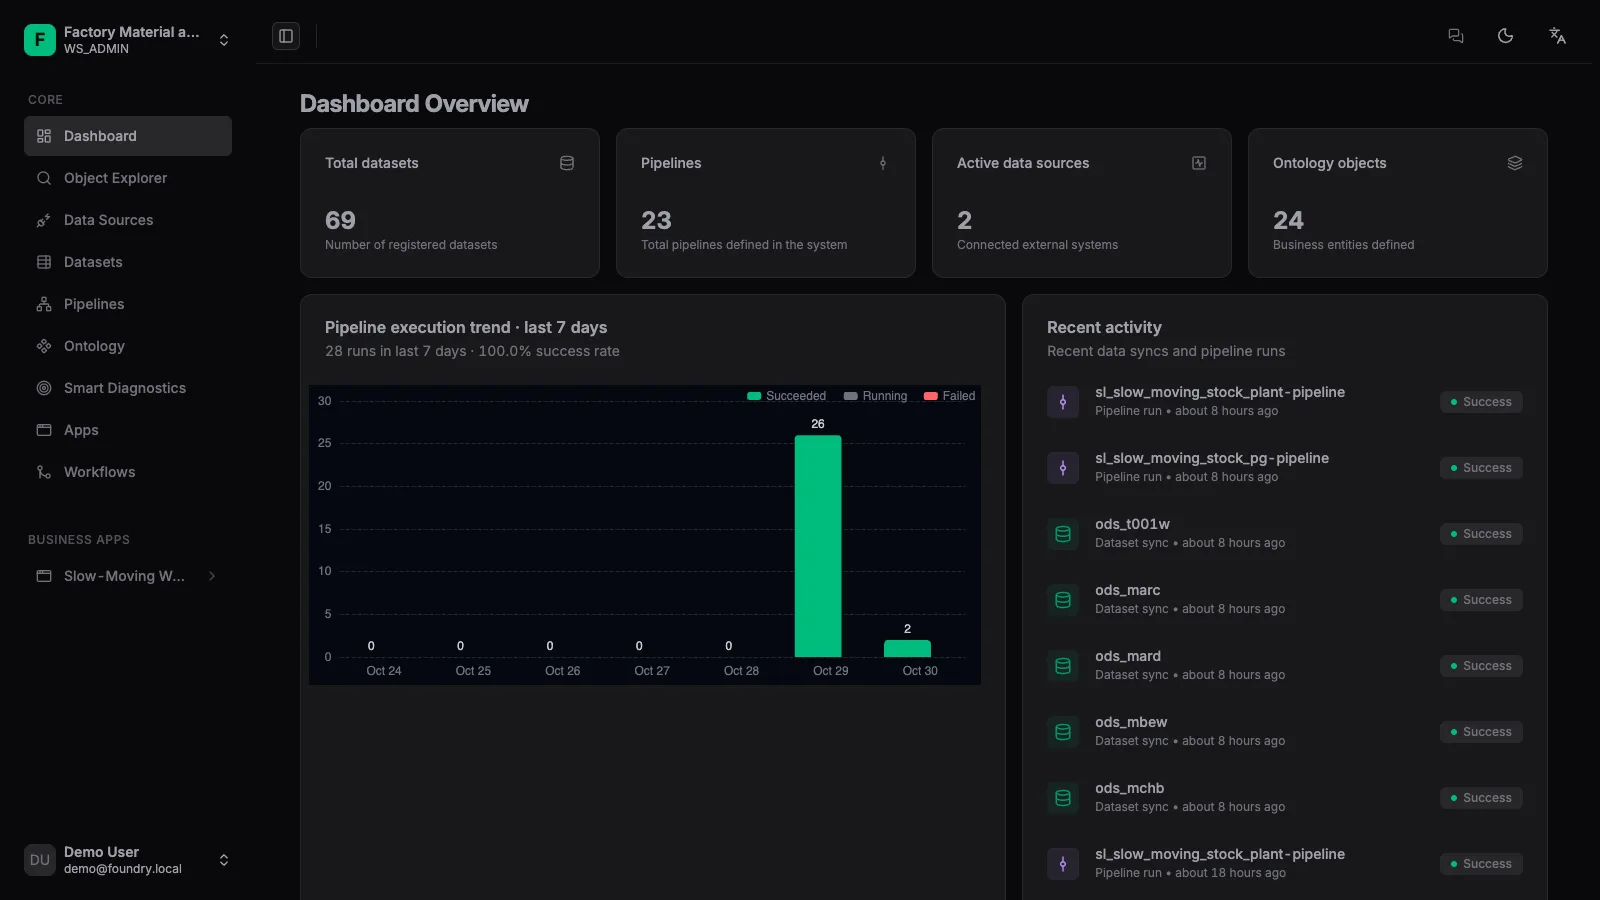
The dashboard is the default landing page after you enter a workspace — one screen that answers: how much data is connected, how the pipelines are doing, and what happened recently.
1. Resource footprint
The four cards at the top count datasets, data pipelines, active datasources and ontology objects. They refresh automatically when you switch workspaces.
2. Pipeline execution trends
The trend chart groups recent run results by succeeded / running / failed, so you can tell whether failures are sporadic or clustered.
3. Recent activity
The right side lists dataset syncs and pipeline runs in reverse chronological order; each entry links to its module.
The dashboard only aggregates and navigates. Modeling, orchestration and permission work still happens in their respective left-side menus.